Venn Diagram & Set Theory
The diagram that shows all possible logical relations between a finite collection of different sets is known as Venn Diagram or Set Diagram.


Before diving into the Venn Diagram first let’s understand what is a set.
A Set is a collection of Objects.
Venn Diagrams are diagrams containing circles that show the logical relations between a collection of sets or groups.

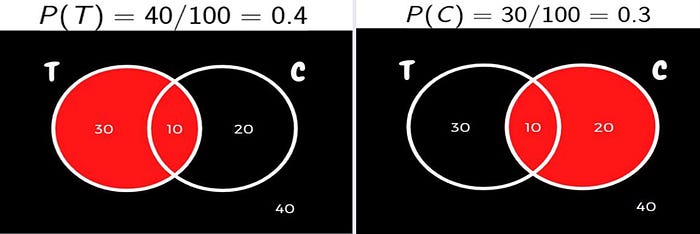
Let’s consider the above diagram and start to understand the Venn diagram.
There are 100 persons in total in which 30 persons drink Tea,20 persons drink Coffee,10 persons drink both Tea & Coffee and the remaining people neither drink Tea nor Coffee.
In the above Diagram there a two sets namely
* Set TEA= People who drink Tea.(40)
* Set COFFEE=People who drink Coffee.(30)
These Set are illustrated using Venn diagram for better Understanding.

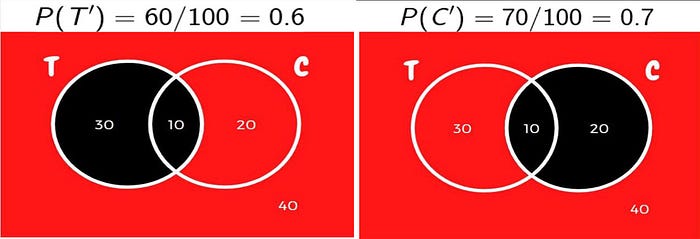
COMPLEMENT
Complement → It is represented as

It includes all the people who don’t drink Tea. Let’s use this in our Example and see

SET OPERATIONS
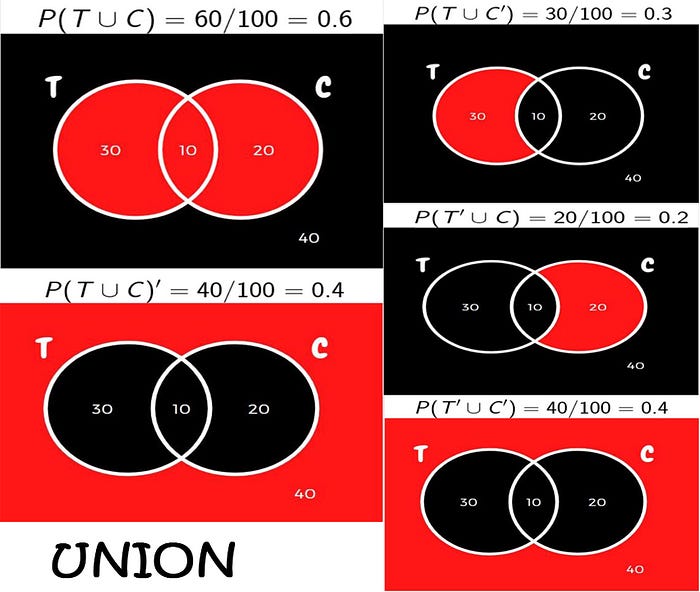
UNION
Union → It is represented as

It includes people who drink tea, coffee or both. Let’s use this in our Example and see

INTERSECTION
Intersection → It is represented as

It includes people who drink both tea and coffee. Let’s use this in our Example and see

SET DIFFERENCE
Set Difference →It is represented as

It includes people who drink either only Tea or Coffee but not both. Let’s use this in our Example and see

SYMMETRIC DIFFERENCE
Symmetric Difference → It is represented as

It includes people who drink either only Tea and only Coffee but not both. Let’s use this in our Example and see

Venn Diagram is also used in Machine Learning. In a Classification problem for Model evaluation confusion matrix is used. The Confusion Matrix can be represented by Venn Diagram.

